Methodology Summary: Block Bootstrap Portfolio Return Forecasting
This model uses a block bootstrap method to forecast portfolio returns. In simple terms, we take actual historical returns, cut them into 10-year blocks, and shuffle those blocks to create thousands of possible future return paths.
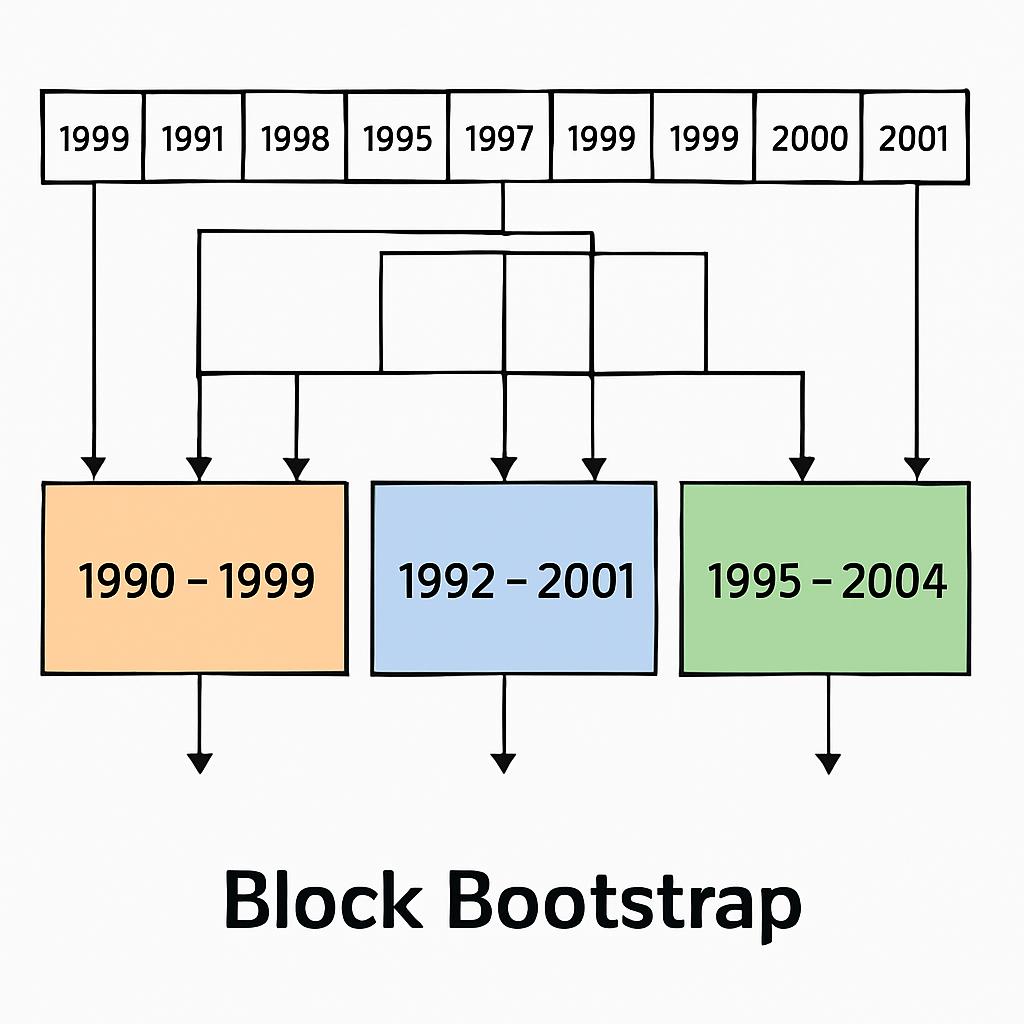
For example, one block might be 1983–1992; another might be 1975–1984. This approach is like shuffling a deck of cards — but each “card” is a decade of market history.
The benefit is that it keeps real-world patterns intact, such as bull markets, bear markets, and periods of high inflation or high interest rates. It’s often more realistic than simply mixing individual years, which can miss the natural “ups and downs” investors experience.
How It Differs From Monte Carlo Simulations
Monte Carlo simulations build thousands of potential futures by assuming a mathematical pattern (e.g., “stocks grow 6% per year with X% volatility”) and rolling the dice many times. This lets us test scenarios that have never happened in history, but it depends on how accurate our assumptions are.
Block bootstrap, by contrast, stays grounded in actual historical data. It captures the sequencing of returns — prolonged growth, deep drawdowns, and shifts between asset classes — as they really happened.
Data Sets
- S&P 500 (with dividends) – NYSE Stern School, 1970–present
- US Small Cap (bottom decile) – NYSE Stern School, 1970–present
- 3-Month Treasury Bill – NYSE Stern School, 1970–present
- 10-Year Treasury Bond – NYSE Stern School & Federal Reserve, 1970–present
- Baa Corporate Bonds – NYSE Stern School & Federal Reserve, 1970–present
- Real Estate – NYSE Stern School, 1970–present
- Gold – NYSE Stern School, 1970–present
- Inflation (CPI) – NYSE Stern School, 1970–present
- International Stocks (ex-US) – MSCI, 1970–present
- Emerging Markets – MSCI, 1988–present
- NASDAQ 100 – NASDAQ, 1986–present
- Bitcoin – various sources, 2010–present
Assumptions and Limitations
When including Emerging Markets and NASDAQ 100 we cut out the earlier block with no data. This reduces the number of blocks, while keeping the historical data.
Due to their limited data and volatility crypto currencies use a projected returns computed by fitting a power law function to a set of monthly data staring in April 2020. Optionall you may select to use the historical data for crypto currency prices. With historical prices, certain data is missing (e.g., Bitcoin before 2010). In that case the return is treated as flat — similar to holding cash. This means earlier periods show no impact from these assets until they existed historically.
Taxes are simplified estimates using current tax rates and schedules; historical tax changes are not modeled. Results will vary by individual situation.